How I help hospitals improve diagnosis detection
Across finance, healthcare, e-commerce, and social platforms, the same core algorithmic principle applies: efficiently discovering meaningful co-occurrence patterns at scale. PCY enables this by reducing memory, computation, and noise—turning raw data into actionable insight.
AI/ML
1/19/20264 min read


When hospitals approach me, they usually don’t ask for an algorithm.
They ask questions like:
“We have years of patient data, but patterns are hard to see. How do we detect meaningful symptom combinations early?”
The challenge isn’t data availability — hospitals have plenty of it. The challenge is transforming raw clinical records into actionable diagnostic signals without overwhelming clinicians or infrastructure.
From a data perspective, the goal is to discover which symptoms, diagnoses, or treatments frequently occur together across patient visits — reliably and at scale.
How I model the problem
Before choosing any algorithm, I first decide how the clinical reality should be represented mathematically.
This modeling step is where most of the value is created.
Here’s how I frame it:
Transaction → One patient visit
Each visit captures a snapshot of observed symptoms, tests, and treatments at a specific moment in time.Items → Symptoms, diagnoses, or medications
Each clinical observation becomes a discrete item that can participate in patterns.Itemsets → Co-occurring clinical signals
If symptoms appear together repeatedly across visits, they may indicate an underlying condition or care pathway.Support threshold → Clinical significance filter
I define a minimum number of patients in which a pattern must appear before it is considered meaningful.
This framing lets me translate an open-ended medical question into a precise, testable data-mining problem.
Why PCY is needed in healthcare analytics
Once the problem is modeled this way, a constraint becomes immediately obvious.
Hospitals operate with:
Thousands of symptoms, lab tests, medications, and procedures
Millions of patient visits
Extremely sparse combinations
If I attempted brute-force counting of every possible symptom pair, the system would collapse under combinatorial load.
That’s why I choose PCY.
PCY allows me to:
Filter unlikely symptom pairs early
Use hash buckets as a low-cost pre-screening mechanism
Reserve exact counting only for combinations that show real promise
This design choice is about respecting both clinical complexity and computational reality.
What hospitals ultimately get
By structuring the problem and applying PCY, I produce:
Frequent symptom pairs → recurring clinical patterns
Candidate pairs → combinations worth clinical attention
Final frequent pairs → evidence-backed signals for diagnosis support
💡 Medical value: improved diagnostic awareness, earlier detection of patterns, and more consistent treatment planning.
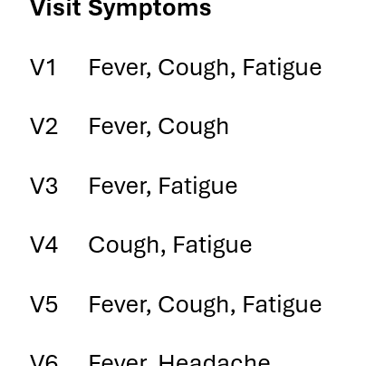
Step 1: Patient visits as transactions
Once the modeling is clear, I move to data preparation.
I treat each patient visit as a transaction.
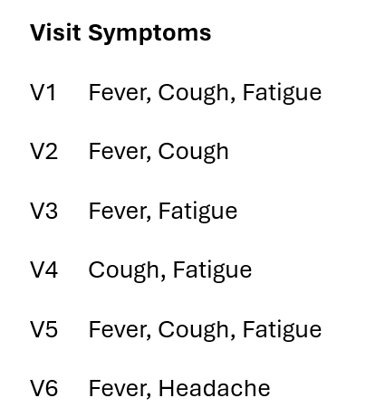
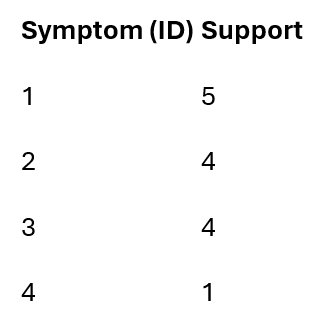
To make this computationally efficient, I encode symptoms numerically:
1 = Fever
2 = Cough
3 = Fatigue
4 = Headache
I then define:
Minimum support = 3
This means a symptom or symptom pair must appear in at least three patient visits to be treated as clinically relevant rather than incidental.
Step 2: Single-symptom support (what I eliminate first)
Before looking at interactions, I intentionally simplify the problem.
I count how often each symptom appears on its own.

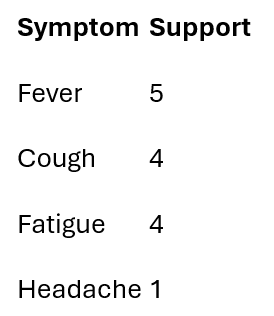
Only symptoms meeting the support threshold survive.
Frequent symptoms: {Fever, Cough, Fatigue}
Numeric support view:

I drop Headache at this stage — not because it lacks clinical importance, but because this specific dataset doesn’t provide enough repeated evidence to support reliable co-occurrence analysis.
This early pruning is deliberate: it prevents rare cases from distorting broader diagnostic patterns.
Step 3: PCY hashing (how I control combinatorial growth)
Now I apply the first PCY pass.
Instead of storing all symptom pairs explicitly, I hash pairs into buckets and count bucket frequencies.
Example hash function:
h(i,j) = (i + j) mod 7
Hashed pairs:

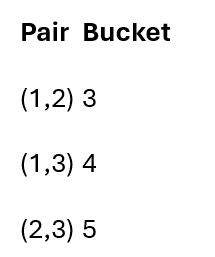

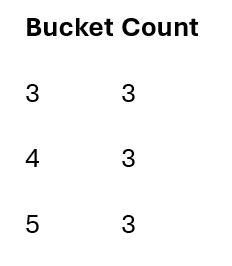
As visits are processed, bucket counts accumulate.
Only buckets meeting the support threshold survive.
This step filters out:
Rare symptom combinations
Noise from isolated cases
The majority of unnecessary computation
Hash collisions are acceptable here — they only make the filter conservative, not incorrect.
Frequent items after pass 1: L1 = {1,2,3}
Step 4: Pass 2 – How I define candidate symptom pairs
Now I deliberately narrow focus.
I form candidate pairs (C₂) using two strict criteria:
Both symptoms must be individually frequent
Their hash bucket must be frequent
Candidate pairs:
Fever–Cough
Fever–Fatigue
Cough–Fatigue
Formally:
C2 = {(1,2),(1,3),(2,3)}
This ensures that every pair I examine has already passed multiple evidence filters.
Step 5: Final counting (where I trust the result)
Only now do I perform exact counting — and only on candidate pairs.

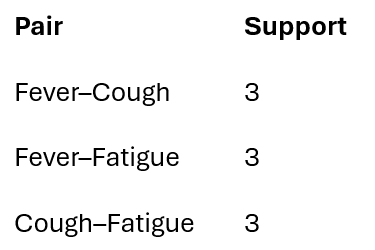
Final frequent symptom pairs: L2 = {(1,2),(1,3),(2,3)}
These are symptom combinations that consistently co-occur across patient visits, not statistical coincidences.
What this means clinically
Because of how the problem is modeled and filtered, doctors can now see:
Recurring symptom clusters
Early warning patterns
Evidence-based correlations grounded in patient data
Nothing here is inferred, assumed, or imposed by the model — it simply surfaces what repeatedly occurs.
Medical value
By carefully modeling the problem before applying algorithms, I help hospitals:
Detect diagnostic patterns earlier
Reduce cognitive load on clinicians
Scale pattern discovery across millions of records