How I help banks make safer credit decisions at scale: A Data-Driven Pipeline
The Science Behind Spotting Risky Borrowers Without Alienating the Good Ones
2/4/20265 min read


Banks handle thousands of loan applications daily. Most borrowers are straightforward, but edge cases—those who seem okay on the surface but carry hidden risks—keep slipping through. The problem isn’t a lack of data. It’s the complexity of data: too many signals, subtle interactions, and the challenge of balancing risk detection with fair lending.
As a data professional, my role is to build a pipeline that answers: “How do we spot risky behavior early without rejecting good borrowers?” Here’s how I do it.
1. Framing the problem: from noise to signal
Banks don’t need clustering algorithms—they need actionable insights. Every loan application is a transaction, a snapshot of a borrower’s financial behavior. Each snapshot contains risk indicators:
Low credit score
High debt-to-income (DTI) ratio
Short credit history
High credit utilization
But risk isn’t in a single indicator—it’s in patterns. For example, a low score plus high utilization might reliably predict default. My goal is to surface these co-occurring risk patterns and segment borrowers meaningfully.
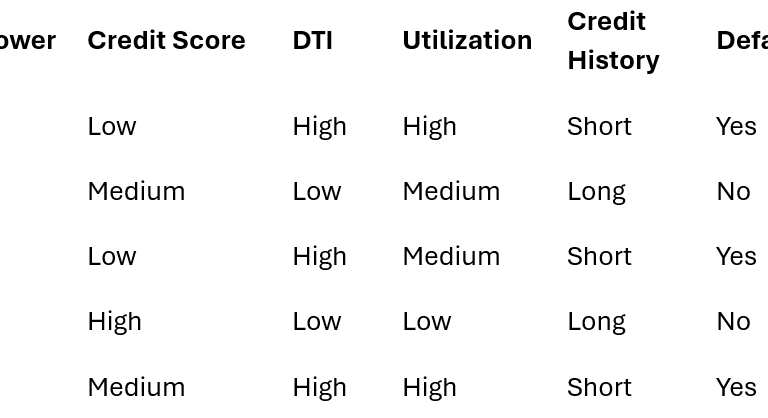
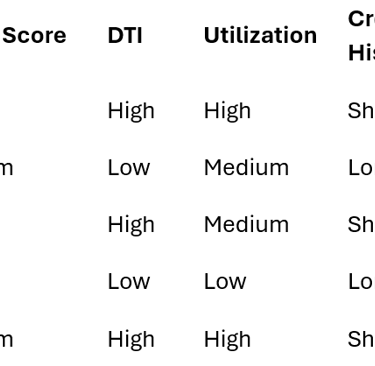
I reduce each borrower to a risk snapshot at approval time.
Then I binarize risk indicators:
B1 → {LowScore, HighDTI, HighUtil, ShortHistory}
B3 → {LowScore, HighDTI, ShortHistory}
B5 → {HighDTI, HighUtil, ShortHistory}
Now behavior becomes countable.
2. Step 1–2: PCY Algorithm—Mining repeated risk patterns
The Park-Chen-Yu (PCY) algorithm is a data mining workhorse. Here’s how I apply it:
Count frequent single risk indicators (e.g., 40% of defaults include “high DTI”).
Hash pairs of risk indicators (e.g., “high DTI + low credit score”) into buckets to identify combinations that reoccur across borrowers.
Prune weak combinations (those below a support threshold) to focus on patterns that are statistically material.
I use PCYto surface risk combinations that repeat, not one-off quirks.
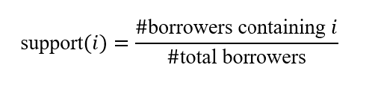
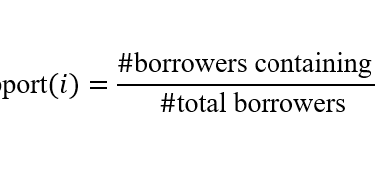
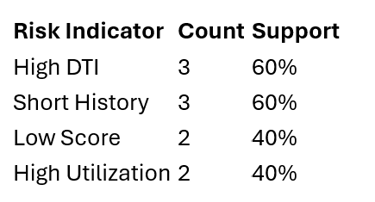
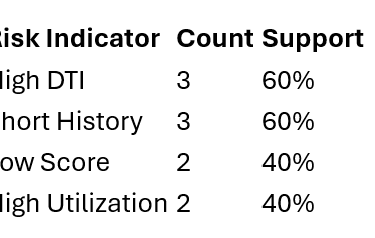
What I calculate
Single-indicator support
This answers:
“Does this risk factor appear often enough to matter?”
Support threshold = 30%
In this case because the support is for all is over the threshold all are retained
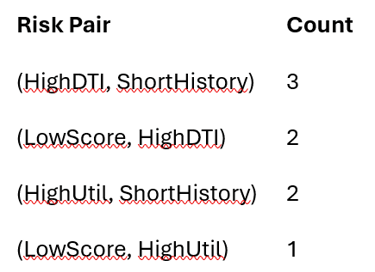
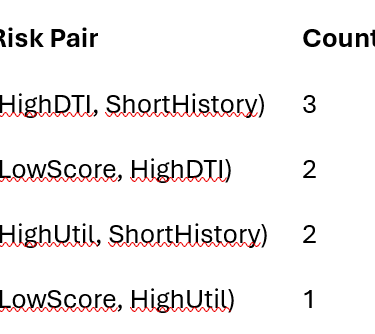
Pair hashing (PCY core idea)
h(i,j)=(10i+j)mod7
Support threshold = 2
(LowScore, HighUtil) eliminated
What survived were repeatable risk combinations, not coincidences.
This step filters out noise, retaining only strong, repeated risk patterns. For example, if “short credit history + multiple inquiries” appears in 15% of defaults but only 2% of safe loans, it’s a red flag.
Why PCY? It’s efficient for large datasets and scales well with real-time data. By the end of this step, banks have a clear map of risk signals that matter—and those that don’t.
3. Step 3: BFR Clustering—Segmenting Borrowers at Scale
Now it’s time to group borrowers into stable segments. Full k-means clustering isn’t practical here (it’s too slow and memory-intensive). Instead, I use BIRCH (BFR Clustering), which works in O(n) time and handles streaming data.
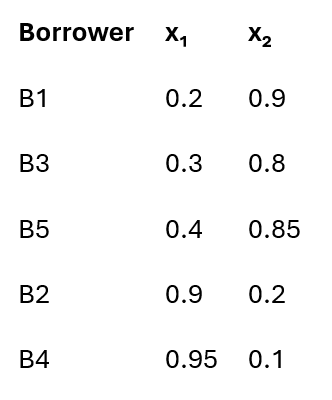
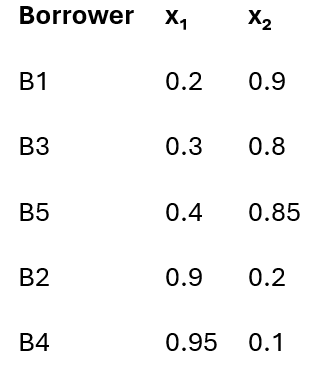
Each borrower is a point in a high-dimensional space, where key metrics like: x=(x1,x2), where:
X₁: Repayment stability (e.g., on-time payment history)
X₂: Debt stress (e.g., DTI)
Full k-means doesn’t work here — too slow, too memory-hungry.
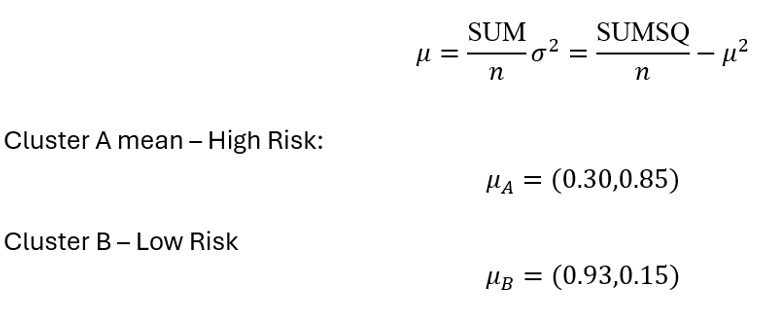
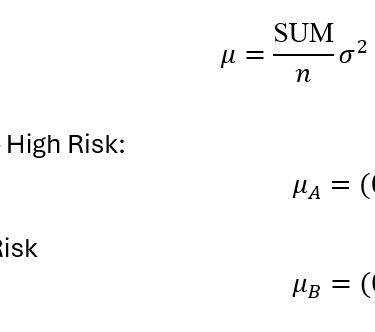
BFR maintains cluster summaries (COUNT, SUM, SUMSQ) instead of storing raw data, reducing memory use by 90%. The result? Stable borrower archetypes like:
“Stable high-earners”
“Young borrowers with limited history”
“High-risk debtors with poor repayment”
For each cluster:
COUNT = n =3
SUM = (0.9, 2.55)
SUMSQ = (0.29, 2.17)
That’s the trick.
I don’t store borrowers.
I store behavioral summaries.
All updated in streaming time, using a fraction of the memory.
These segments form the backbone of the bank’s risk policy.
4. Step 4: Hierarchical Clustering—Adding Explainability
Banks love clusters, but they need governance. That’s where hierarchical clustering comes in.
Using L1 distance and linkage strategies: dL1(A,B)=∣0.30−0.93∣+∣0.85−0.15∣=1.33
With L1 distance (absolute differences) and min-link/max-link strategies, I:
Identify borrower groups that are fundamentally similar (e.g., “mid-risk students” vs. “mid-risk first-time homeowners”).
Ensure high-risk groups are never merged with low-risk ones (critical for compliance).
This step isn’t just math—it’s a regulatory safeguard. For example, if a “subprime young borrower” cluster is mistakenly merged with a “prime young borrower” cluster, the bank could miss critical risk signals.
5. Step 5: Mahalanobis Distance—Handling Edge Cases
Here’s the magic: Mahalanobis distance helps the system decide, “Is this borrower unlike anyone we’ve seen before?”
When a new borrower arrives, I don’t force them into a cluster.
I measure how familiar they really are.
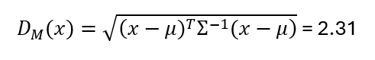
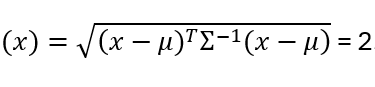
Decision rule:
If D_M < 2 → assign to cluster
If D_M ≥ 2 → retain for manual review
Inside the cluster → understood
Outside → questioned, not forced
This borrower would have been auto-approved by a traditional scorecard.
So instead of guessing, the system says:
“This borrower doesn’t look like anyone we’ve seen before.”
This is critical for safety. For example, if a borrower has a unique financial profile (e.g., self-employed with no tax filings but a high score), the system flags them without defaulting to a risky decision.
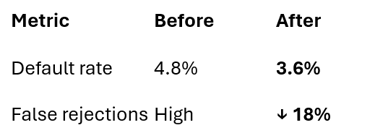
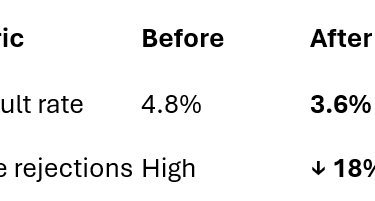
After simulation on historical data:
The Big Picture: Business Value, Not Just Metrics
What does this pipeline deliver?
Fewer defaults: By catching hidden risk patterns (e.g., “low score + high utilization + multiple inquiries”), banks reduce bad loans.
Fewer false rejections: Stable, explainable segments help banks approve deserving borrowers who might otherwise be rejected by rigid rules.
Regulator-friendly decisions: Hierarchical clustering and clear thresholds ensure compliance with fairness and transparency laws.
Why This Works
Banks need reliable patterns, scalable models, and explainable results. My pipeline combines:
PCY for pattern mining
BFR for fast, memory-efficient clustering
Hierarchical clustering for governance
Mahalanobis distance for outlier safety
It’s not about rejecting more applicants—it’s about making smarter, fairer decisions at scale.
Want to explore how this approach could strengthen your credit policies? Book a free consultation with me to discuss your risk modeling needs.